Mapping the Moon’s South Pole at One Meter in One Night
How you turn photos lit from thirty directions into terrain, and check the result against data the models never saw.
the most useful thing i learned this weekend is that the moon has already been photographed well enough to map it at one meter. nobody had done the math.
let’s start with the primitive: what is an elevation map?
an elevation map (a DEM) is just a grid of numbers, one per pixel, where each number is the height of the ground. pixel size is the whole game. at 10 meters per pixel a two-meter boulder does not exist. at 1 meter it does.
this matters because landers die on things smaller than 10 meters.
(a lander leg is about a meter. a crater that flips you is about five.)
so the question is: where do you get 1 meter heights for a place no one has ever been?
the three public options, and why they’re not enough
LOLA is a laser altimeter on a satellite. it measured heights directly, which makes it the ground truth for everything, but at the pole the shots are 10 meters apart. between shots you are guessing.
NASA’s shape-from-shading maps are 5 meters. they took the photos, fit terrain to the light, and stopped at 5 because the pipeline was built for 5.
NASA’s deep-learning map is 20 meters. cool method, coarse output.
here is what “10 meters” actually looks like next to a photo of the same place:
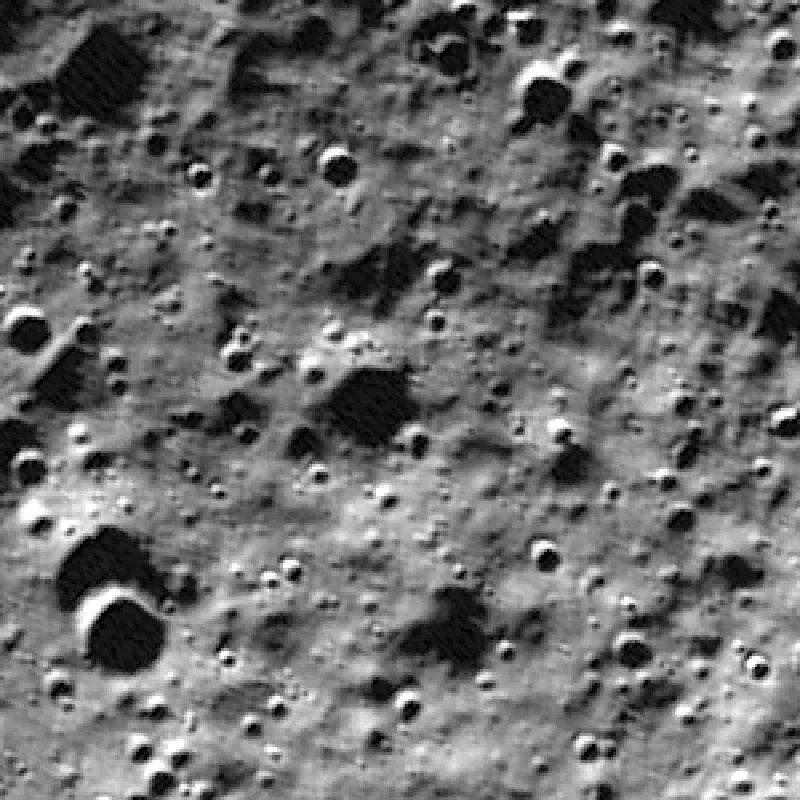 the photo (1 m)
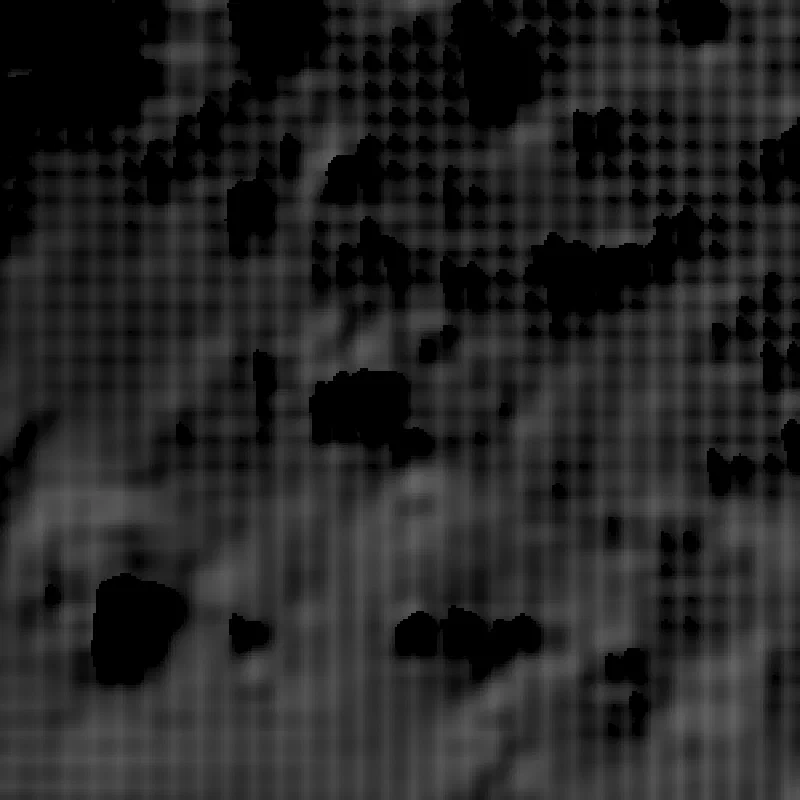 LOLA, 10 m
the idea
a photo is not a height map. but a photo is a function of the height map.
if you know where the sun is, the brightness of every pixel is set by the slope of the ground under it (facing the sun: bright. facing away: dark. behind something: black). that’s shading. one photo gives you one equation per pixel and you’re solving for height, so one photo is not enough. you can trade a slope for a brightness in too many ways.
now the trick: LRO has been circling the moon for fifteen years and the polar sun goes all the way around the horizon every month. so every square meter of the south pole has been photographed with the light coming from the north, the east, the south, the west, and everything in between.
LROC (the camera team) already stacked those photos into mosaics binned by sun direction. 23 to 36 bins per tile, 1 meter per pixel, co-registered. they’re public.
the shape of the ground is the one thing that is the same in all of them.
so you write down a renderer: give it a height map and a sun direction, it produces what the photo should look like, including the shadows one crater throws on the next. then you ask for the single height map whose renders match all thirty photos at once. there is only one terrain that casts every shadow correctly from every direction.
that’s it. that’s the whole method. the rest is engineering.
two ways to solve it
the direct way: start from LOLA, and nudge every pixel’s height until the renders match. coarse to fine, 8 m, 4 m, 2 m, 1 m. this is shape-from-shading, the same idea NASA used, except we use thirty suns instead of one and go to 1 m.
the learned way: train a small neural network (a UNet) that looks at the thirty photos and outputs the height correction directly. the training signal is the same renderer: it gets rewarded when its map renders into the real photos. no labels, no NASA maps, nothing human in the loop.
we ran both, at every site.
how you know it’s not making things up
this is the part that matters and the part most map papers skip.
a model that has seen the photos will reproduce the photos. so before training we hid three things:
- sun bins. every fifth sun direction was held out and never shown to either model. after training we render the map under those hidden suns and compare to the hidden photos. if the terrain is real, the photos it never saw match.
- LOLA blocks. sixteen 300-meter patches where the laser heights were removed from the fit. we check the heights there afterward, in meters.
- referees. at the IM-2 site there’s an independent stereo DTM. at one tile there’s NASA’s 5 m map. we score against both.
the metric for the hidden photos is correlation (NCC), 0 to 1: does the rendered image line up with the real one. LOLA scores about 0.65 everywhere. a perfect map would score near 1.
the results
26 sites finished. all 26 beat LOLA on the hidden photos, typically going from about 0.65 to about 0.90. median gain 0.23.
the sites are not random: the IM-2 landing site, all nine Artemis III candidate regions, the Chang’e-7 target on the Shackleton rim, the Chandrayaan-4 sample-return site, Connecting Ridge, the pole itself, and a few crater floors.
before any more pictures, the two figures that answer the real question: is this terrain, or a photo repainted as heights?
first, the only place with independent truth. at IM-2 there is a stereo DTM, built from parallax between two photos rather than from shading, with 4 m posts. here is each map’s height error against it, and a 300 m cut through a crater LOLA cannot see:
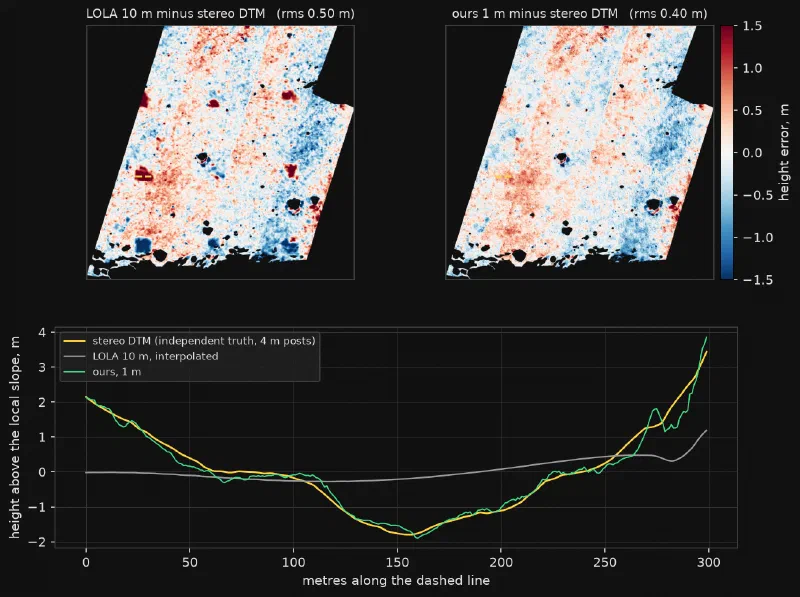
now the same window, live. drag the divider, zoom into any crater with the scroll wheel, click a spot for a cross-section in metres. the third layer is the stereo truth, so you can check both of us against it. the red blocks are the honest part: the 100 m squares where LOLA is closer to the truth than we are, tinted by how much. most are a centimetre or two, inside the DTM’s own noise. the green ones go up to a metre and a half.
this viewer needs JavaScript. the static version is the figure above.
drag to pan · scroll or pinch to zoom · drag the divider · click a spot for a 300 m cross-section
second, the shadow test. a model that painted photo texture into the heights would still look right under a sun close to one it trained on. so take two hidden suns from opposite sides of the sky and render both maps under each:
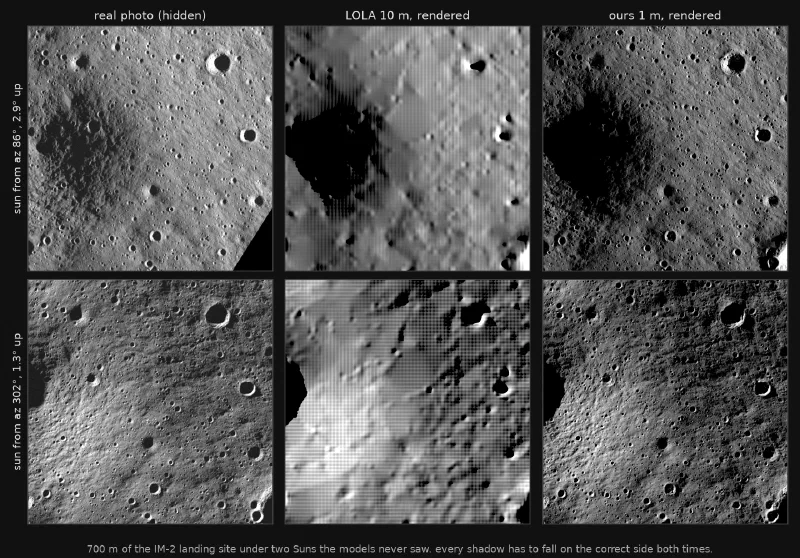
(a note on every render on this page: the right-hand images look like photos because that is the test. each one is a height map lit by a computer, and it is compared to the real photo taken under that sun.)
here’s the one that matters most, because it’s the only place we can compare to NASA’s 5 m map at full resolution. 1.2 kilometers on the Leibnitz Beta plateau, one hidden sun. NASA’s map and ours rendered under it, and the real photo underneath:
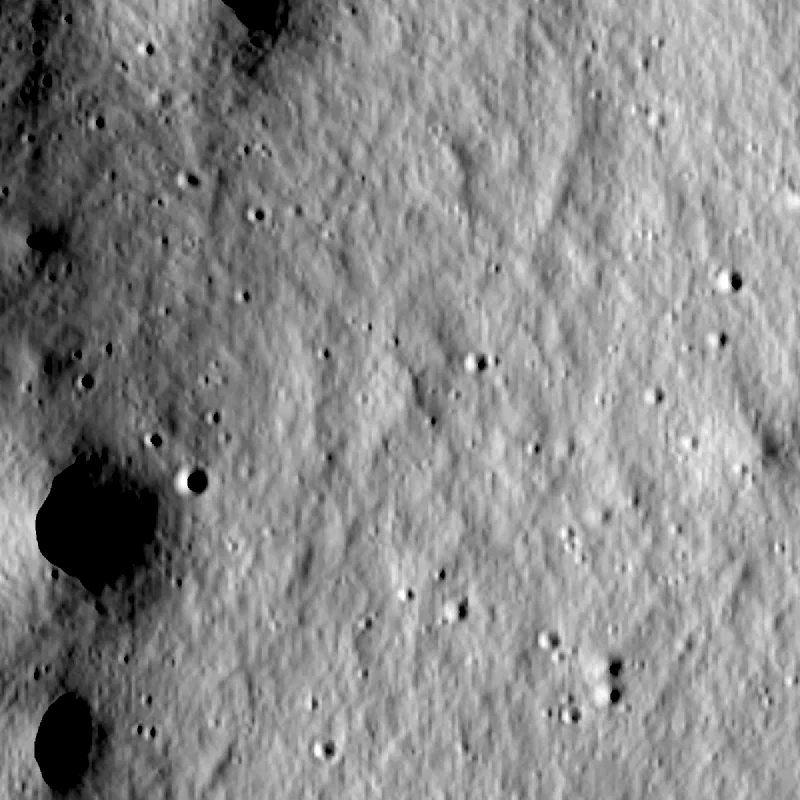 NASA 5 m
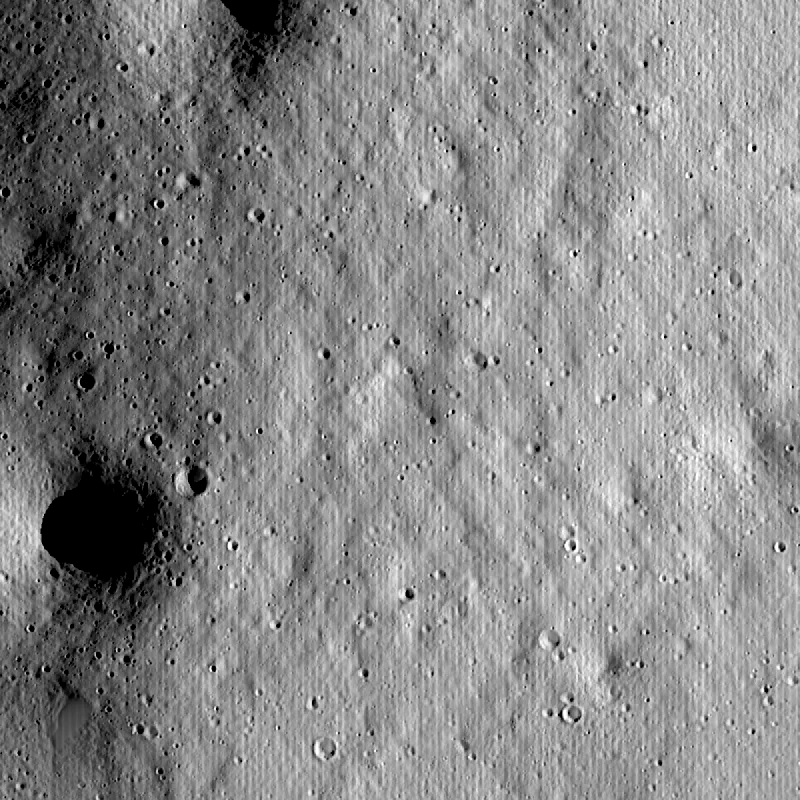 ours, 1 m
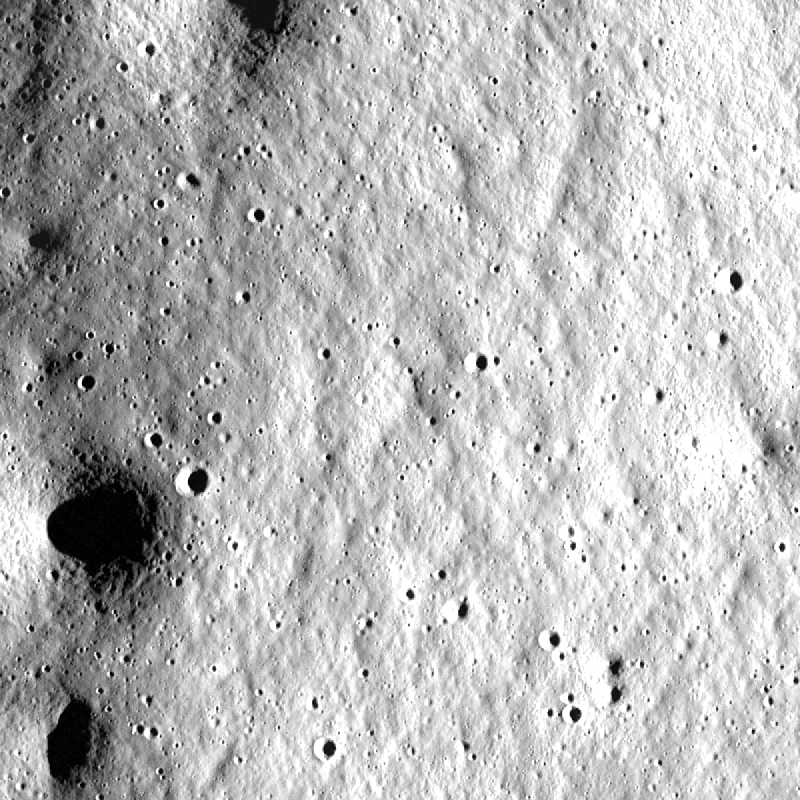
and over NASA’s entire 16 km tile (256 km²):
| test (hidden photos) | LOLA 10 m | NASA 5 m | ours |
|---|---|---|---|
| correlation | 0.68 | 0.81 | 0.90 |
| shadow overlap | 0.82 | 0.82 | 0.86 |
and at the hidden laser blocks, the direct solver typically cuts the error from 1.5 to 3 meters down to 0.6 to 1.5 meters.
LOLA, 10 m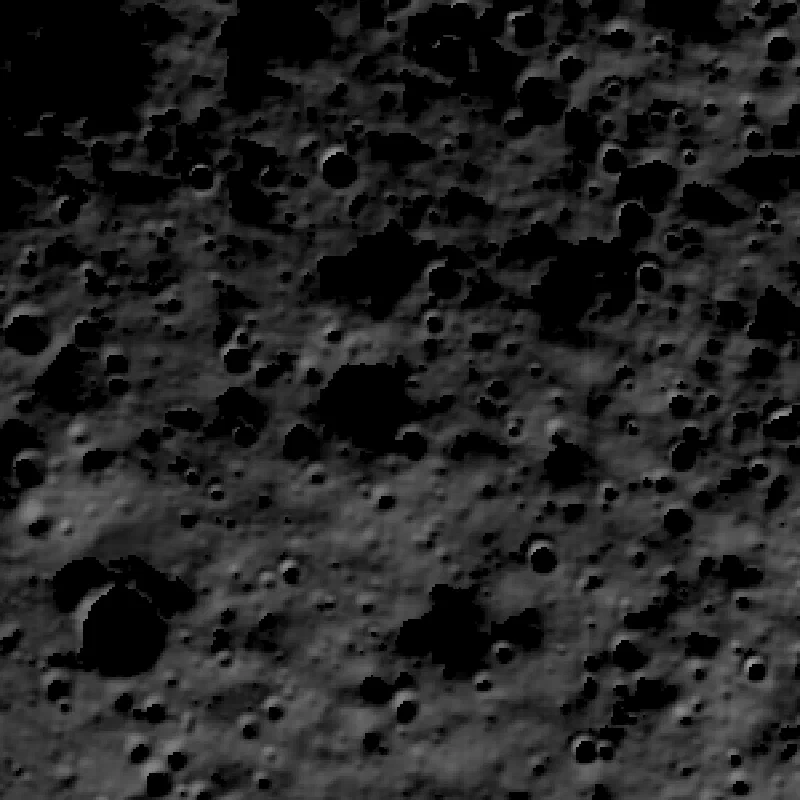 ours, 1 m
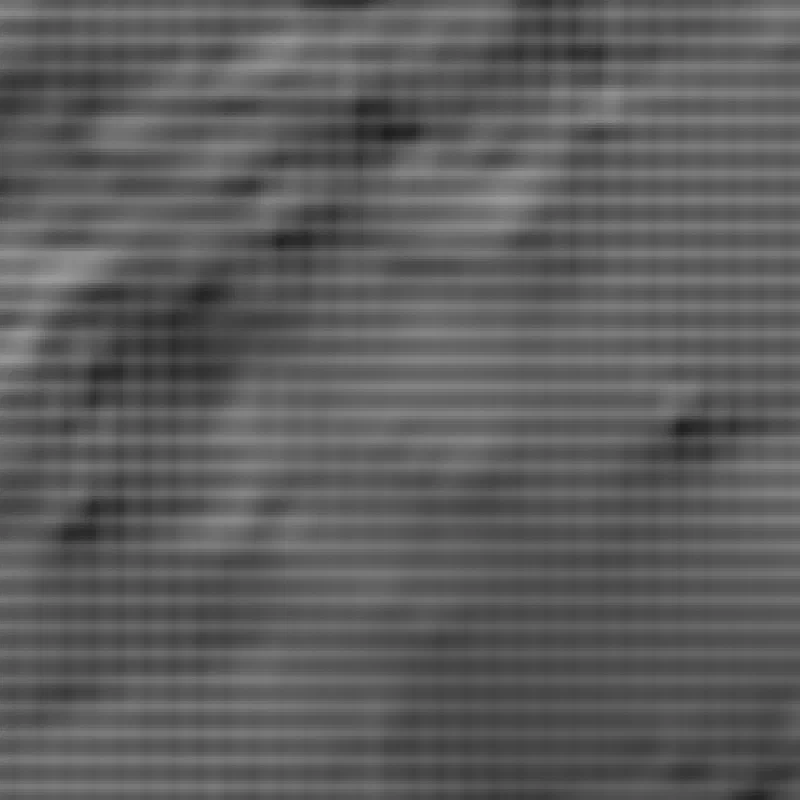 LOLA, 10 m
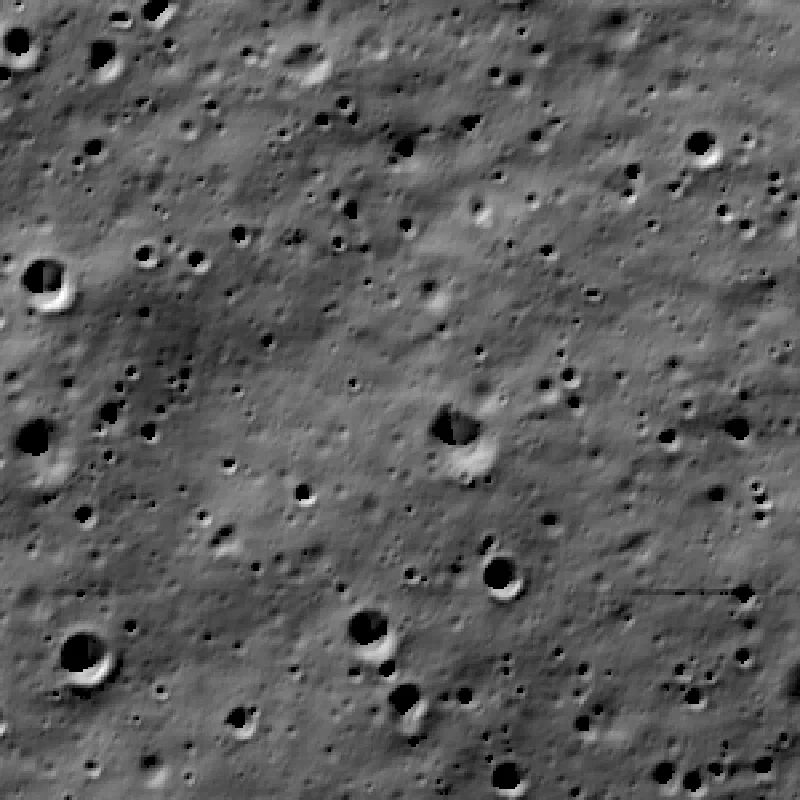 ours, 1 m
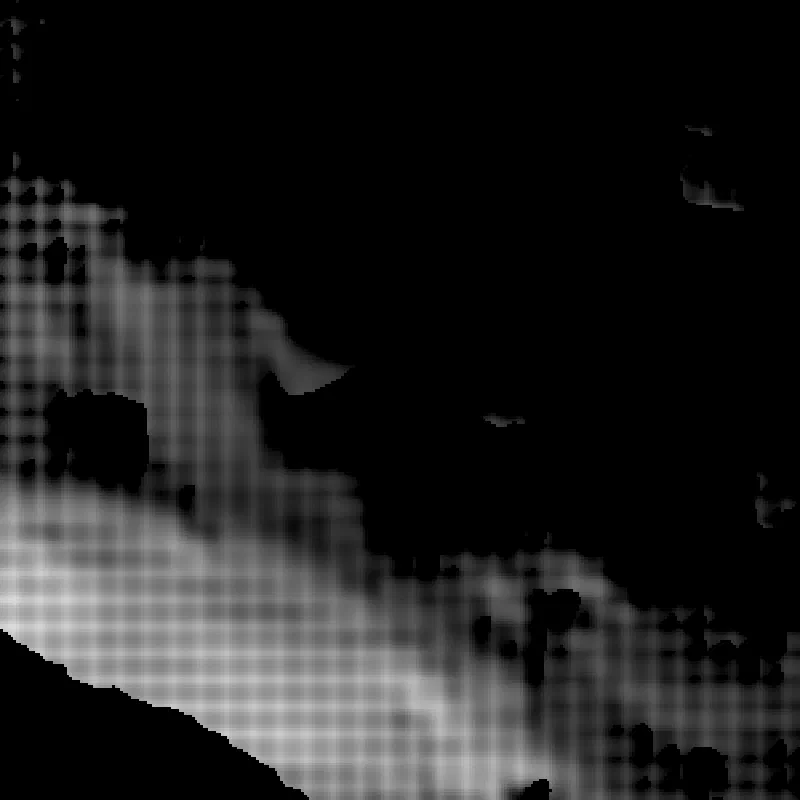 LOLA, 10 m
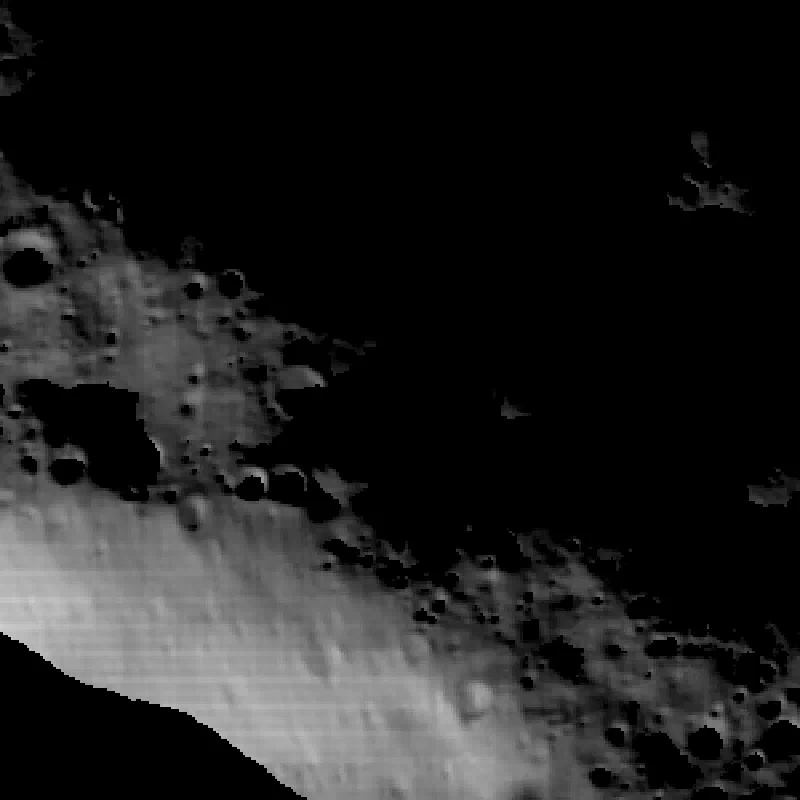 ours, 1 m
every site, with its numbers and its uncertainty map, is on the visualizations page.
what went wrong, because that’s where the learning is
the direct solver was garbage for the first two hours. slopes of 40 degrees on flat ground. the cause was one number: the optimizer step at the 2 m level was 5× too big and the surface blew up. with the step fixed it went from the worst map to the most accurate one. (i want to say this is unusual. it is not. this is what most of the night looked like.)
some sun bins are junk. when the sun is nominally below the horizon the mosaic still has pixels in it, dim and unexplainable. two of those got into a training set and one into a test set, and the Chandrayaan-4 site scored badly for no real reason. filter: drop any bin the LOLA render can’t explain at all, and freeze the train/test split the first time a site is loaded so it can never drift.
the box ran out of memory at 99.5% because every job kept four copies of its image stack. it ran at 18% kernel time because every job spawned 195 threads. two 16 km jobs never launched because i set “a whole GPU” to three slots and then reduced slots to two. all of this is boring and all of it cost real money at $12 an hour.
the biggest miss: results should have been streaming to storage from the box the whole night, not pulled home at 4 MB/s at the end. that’s fixed now and written down.
what it can’t do yet
permanently shadowed crater floors. no light, no shading, no map. LCROSS, Shackleton’s floor, Shoemaker’s floor all had zero usable sun bins.
only one site has independent truth, and it is a 4 m stereo DTM, not 1 m. everywhere else the evidence is hidden photos and hidden laser points, which is strong, but it is not a second instrument.
the hidden suns are not that hidden. every fifth bin is held out, so a hidden sun always has trained neighbors about 15 degrees away. the shadow test above is what rules out interpolation, and the stereo DTM only backs it at one site.
the correlation score is close to what our models optimize. NASA’s pipeline was not built to win it. on raw brightness error NASA’s map is still better at one site, and at the laser points it is closer, because it was fit to them. part of that is our crude per-image exposure model.
our fine detail is too strong. a hidden photo confirms the small craters and ridges are in the right places, but their rendered contrast is 20 to 40 percent higher than the real photo’s. the renderer has no albedo term, so a darker patch of soil can only be explained as a slope. heights are right; slopes at lander scale are an upper bound until we refit with an albedo map, which is the standard fix.
the bin filter (drop any bin the LOLA render cannot explain) was applied before the split, so it touched the test bins too. it removes physically impossible data, but it is a choice made while looking at the test set.
and this is the south pole only, where the mosaics exist. the rest of the moon needs the same idea run on raw images, which is a different (bigger) pipeline.
in short
photos lit from thirty directions --> one renderer --> the only terrain that casts every shadow correctly --> score it on the photos you hid --> 1 meter maps of the places people are about to land.
the data existed, the compute was $150, the math was known. this is one night’s evidence that it works, not a finished map product. the finished version needs stereo truth at more sites.
everything is public. the network weights for every site, the scores, and the site list are on hugging face. the run and the gallery are on this site.